Kshitij Goel Robotics Researcher

Real-Time Information-Theoretic Exploration with Gaussian Mixture Model Maps

RSS · 2019

How to compress LiDAR point clouds into a representation that can enable exploration of 3D spaces?

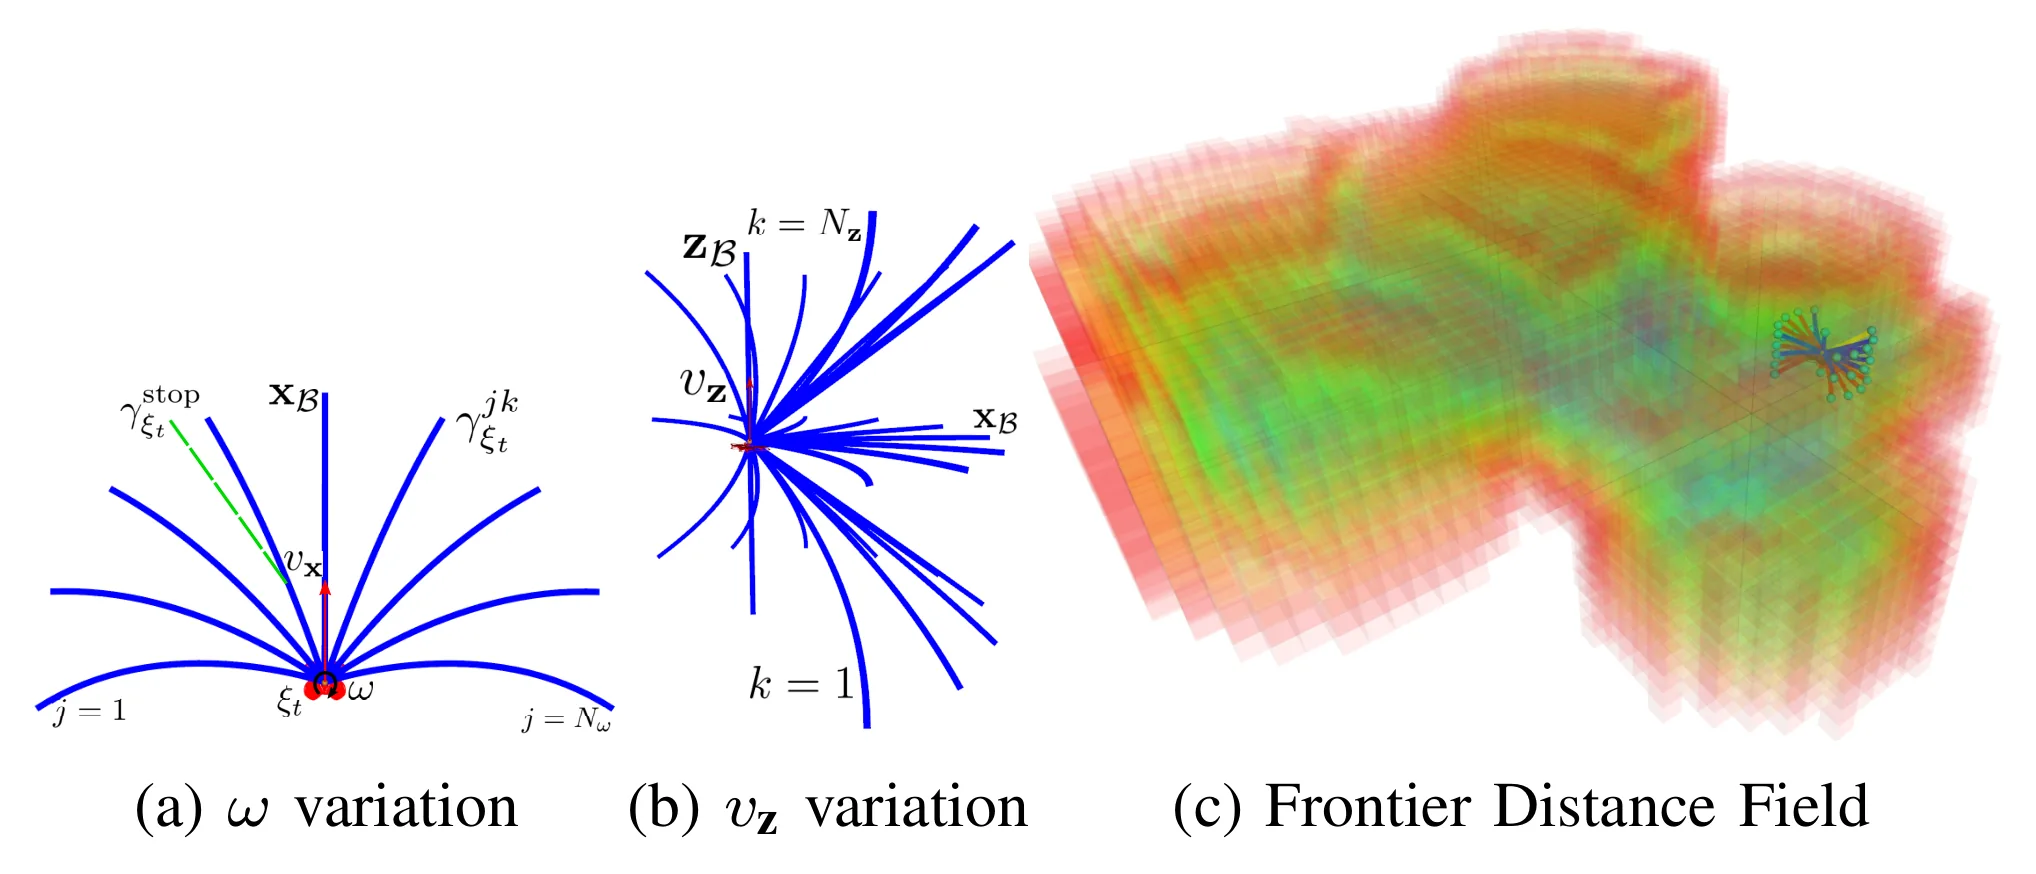
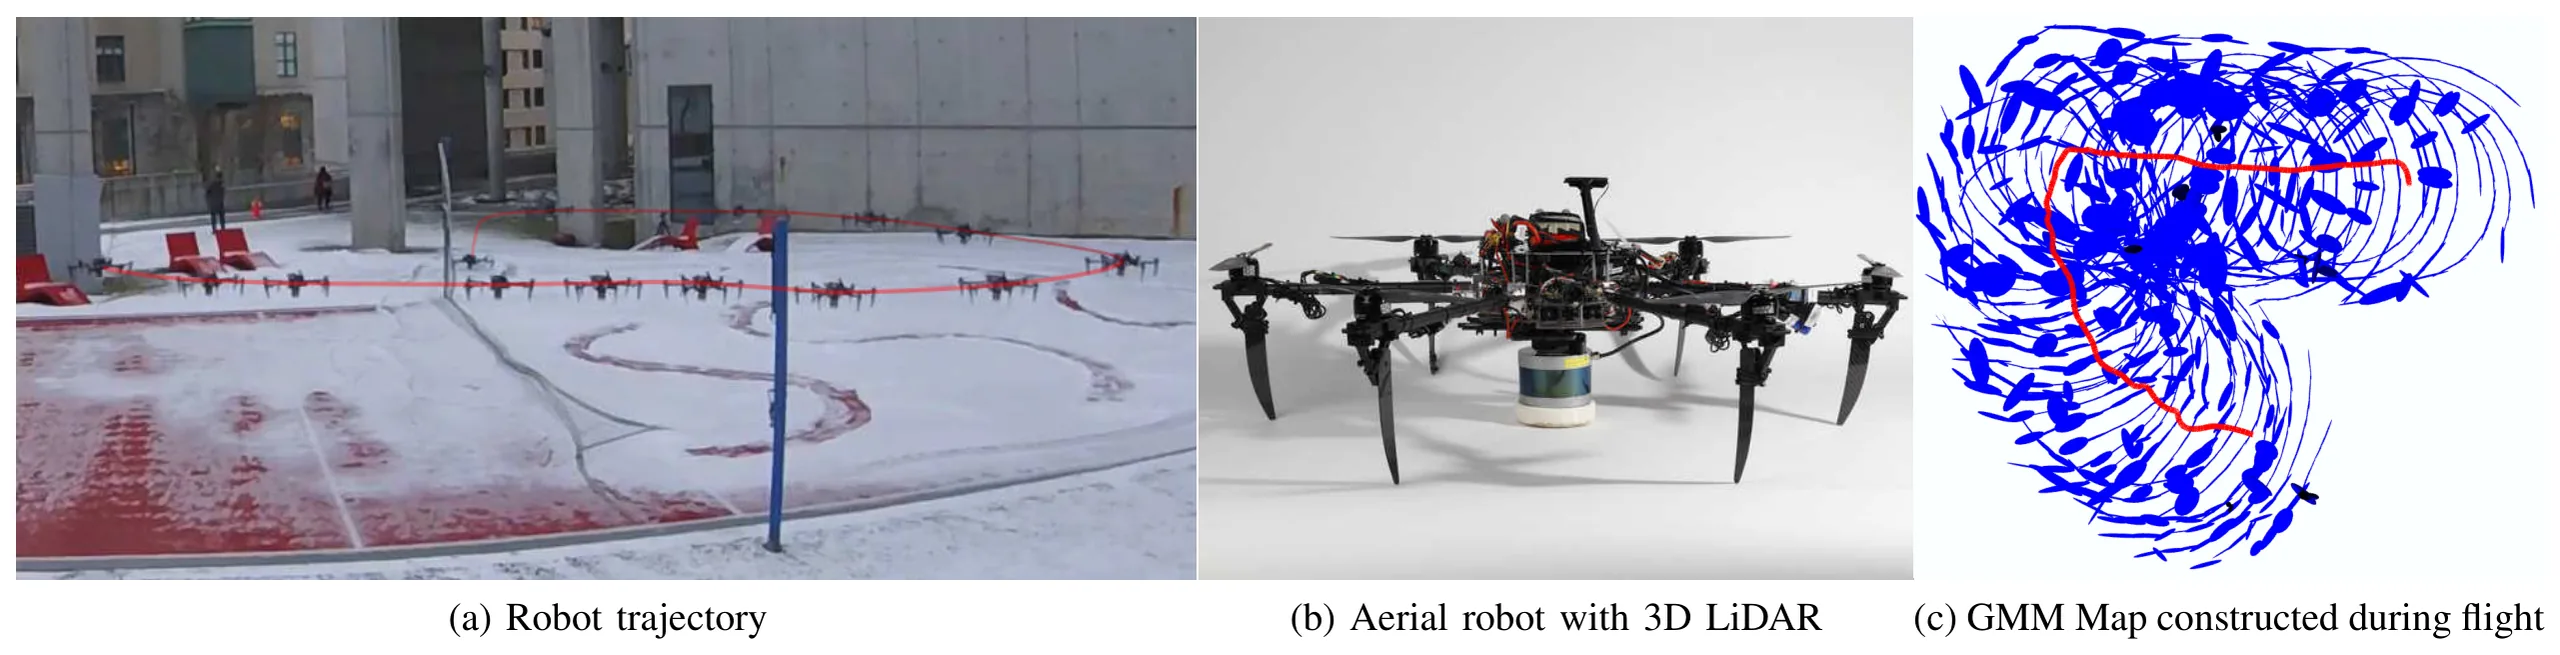
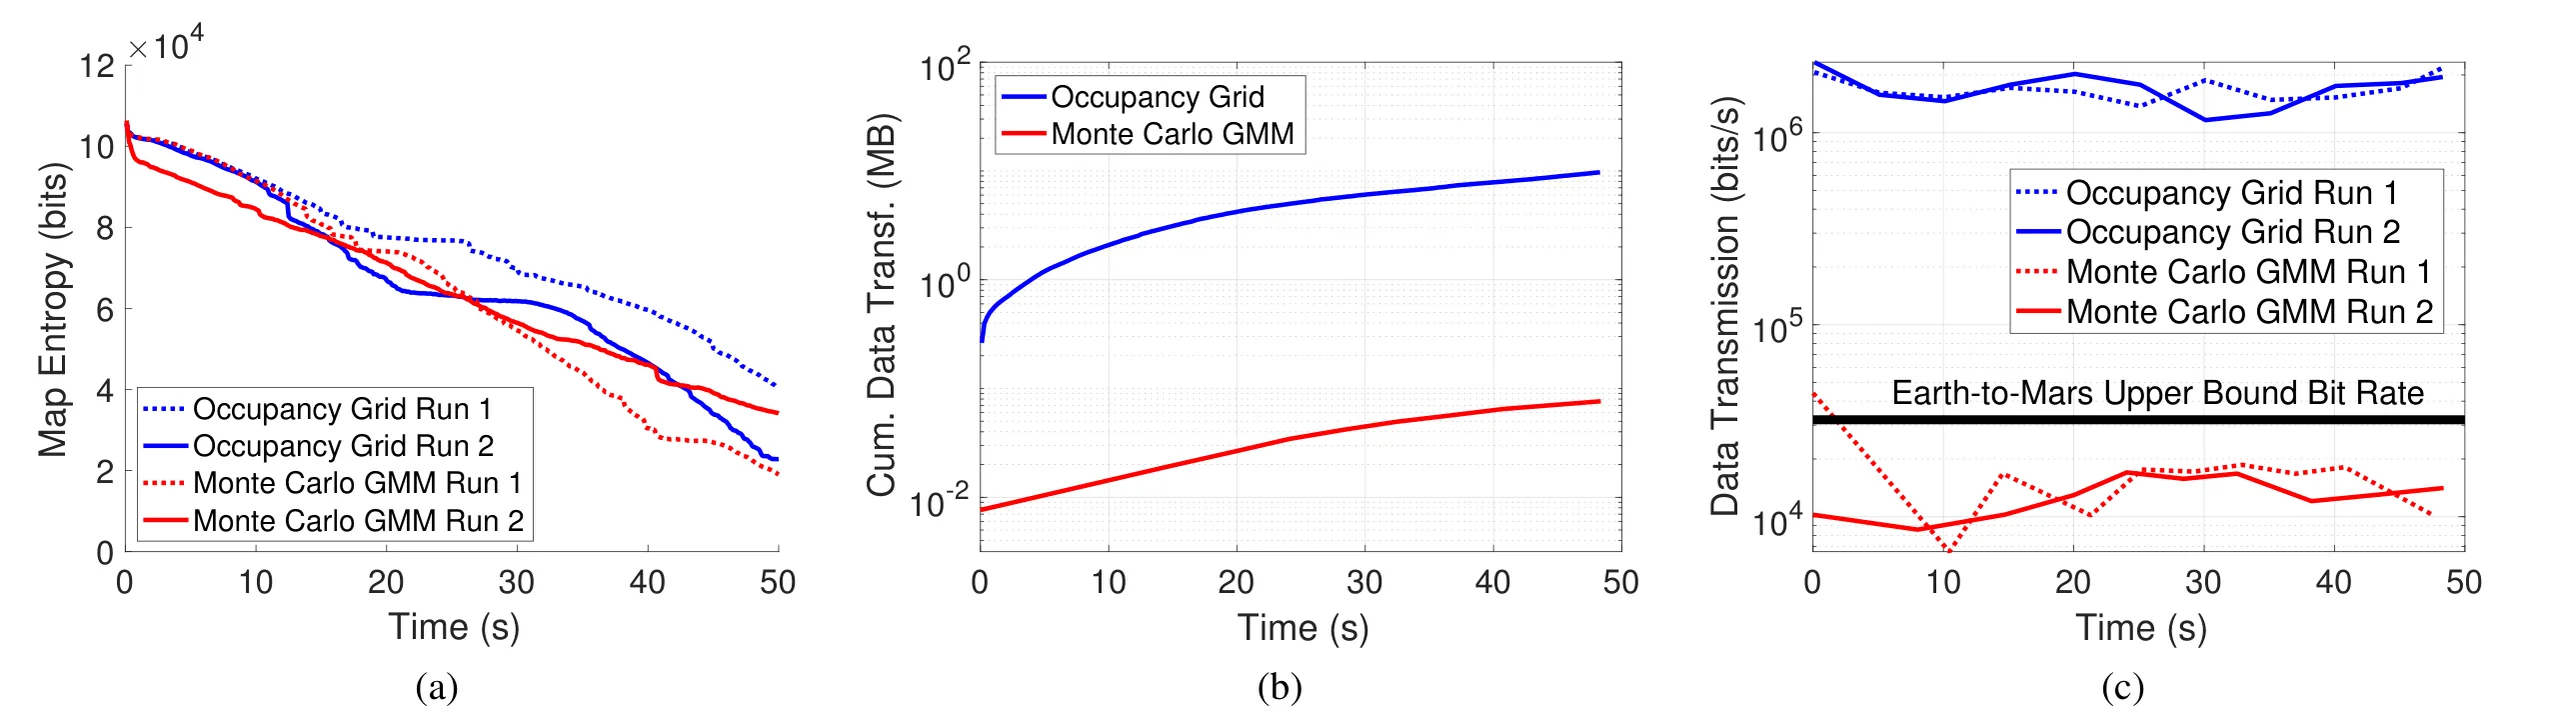
This paper addresses the following problem: How to compress LiDAR point clouds into a representation that can enable exploration of 3D spaces? To solve this, we propose: This paper develops an exploration framework that leverages Gaussian mixture models (GMMs) for high-fidelity perceptual modeling and exploits the compactness of the distributions for information sharing in communications-constrained applications.

Figures

Outdoor Exploration
Outdoor Exploration (a) An autonomous aerial robot equipped with a 3D LiDAR explores an outdoor environment. (b) Top-down view of environment being explored.
System Overview
System Overview Overview of the autonomous exploration system presented in this work. Using pose estimates from a visual-inertial navigation system (Section VI-B1) and 3D laser scans, the proposed mapping method (Section IV-A and Section IV-B) builds a memory-efficient continuous approximate belief representation of the environment while creating local occupancy grid maps in real-time. A motion primitives-based information-theoretic planner (Section V) uses this local occupancy map to generate snap-continuous forward-arc motion primitive trajectories that maximize the information gain over time.
Windowed GMM Construction
Windowed GMM Construction Overview of the approach to transform a sensor observation into a windowed GMM. (a) 3D LiDAR scan from Rapps Cave in Greenbrier, WV. Points at a distance larger than 5 m are normalized to a unit vector and projected to 5 m (dark blue) to represent free space. Points with a norm less than 5 m represent occupied space. (b) A 100-component GMM F(x) is learned over the free space points (dark blue) and 100-component GMM G(x) is learned over the occupied points (red). (c) and (d) illustrate the windowing technique on the occupied and free space points, respectively, by coloring each window in a different color. The GMM learned with windowed pointcloud data is shown in (e). The windowless GMM produces a tighter fit to the data than the windowed GMM which is exemplified in the occupied point component closest to the viewer. The resampled model produced by sampling 1 × 10⁶ points from (e) is shown in (f). The number of points to resample is selected for illustration purposes and to highlight that the resampling process yields a map reconstruction with an arbitrary number of points.
Occupancy Reconstruction
Occupancy Reconstruction Overview of the method by which occupancy is reconstructed (a) The blue bounding box bt+1 is centered around Xt+1 and red bounding box bt is centered at Xt. (b) illustrates the novel bounding boxes in solid magenta, teal, and yellow colors that represent the set difference bt+1 \ bt. (c) Given a sensor origin shown as a triad, resampled pointcloud shown in Fig. 3f, and novel bounding box shown in yellow, each ray from an endpoint to the sensor origin is tested to determine if an intersection with the bounding box occurs. The endpoints of rays that intersect the bounding box are shown in red. (d) illustrates how the bounding box occupancy values are updated. Endpoints inside the yellow volume update cells with an occupied value. All other cells along the ray (shown in blue) are updated to be free.
Motion Primitives
Motion Primitives Forward-arc motion primitives from the multirotor state ξt [26] are obtained after varying yaw rate (a) and vertical velocity (b). Stopping trajectories γstop
Windowed Strategy Quality
Windowed Strategy Quality The quality of reconstruction when opting for the windowed strategy (dashed lines) shown in Fig. 3e as opposed to learning a distribution on all of the data (solid lines) as in Fig. 3b is presented. The effect of partitioning data into 10 windows, learning a distribution on each of the windows, and merging the result does not significantly reduce the quality of the reconstruction. The gains in speed are significant enough to motivate deploying the windowing strategy for real-time operations.
Simulation Statistics
Simulation Statistics Exploration statistics for simulation experiments. (a) Map entropy over time for 30 trials, (b) mean map entropy over time for each method, and (c) three different starting positions (10 trials per starting position per method). Although both methods achieve similar entropy reduction, MCG uses significantly less memory according to the average cumulative data transferred shown in (d). The total amount of transmitted map data after 1500 s is 1.3 MB for MCG, 204 MB for OG, and 4.5 GB (not shown) for raw pointclouds. The maximum variance for the MCG approach is 4.2 × 10−3 MB2 and 1.2 × 102 MB2 for the OG approach. The proposed MCG method represents a decrease of two orders of magnitude as compared to the OG method.
Simulation Environment
Simulation Environment Environment used for simulation experiments, shown in (a), is based on a real cave environment in West Virginia. After 1500 seconds of autonomous exploration, the resulting MCG map (b) is densely resampled to 10 million points to obtain the reconstruction shown in (c). The output of the OG mapping strategy consists of 50, 398 voxels and is shown in (d). Both mapping strategies leverage voxels with 20 cm resolution. (c) and (d) are colored according to z-height.
Hardware Setup
Hardware Setup Experimental setup for hardware trials. (a) Test site for outdoor exploration experiments with robot trajectory highlighted in red. (b) Hexrotor aerial robot used in field tests. (c) Top-down view of the GMM map (blue) constructed during the 60 s flight and the estimated trajectory (red).
Hardware Statistics
Hardware Statistics Exploration statistics for hardware experiments. (a) illustrates the map entropy reduction for two trials of each approach. (b) represents the average cumulative data transferred at a given time in a semi-logarithmic plot where the vertical axis is logarithmic labeled with successive powers of 10. The maximum variance is 2.9 × 10−5 MB2 and 7.2 MB2 for the MCG and OG approaches, respectively. The total amount of data transferred at the end of each hardware trial on average is approximately 78 kB for the MCG mapping approach, 9.7 MB for the OG approach, and 154 MB when transmitting raw pointclouds (not shown). (c) illustrates the bit rate for each approach in a semi-logarithmic plot where the vertical axis is logarithmic labeled with successive powers of 10. The communications bandwidth required for the MCG approach is just under the upper bound on the available Earth-to-Mars bit rate.

Acknowledgments

This work was supported in part by NASA STTR Grant NNX16CK16C and industry. The authors thank Xuning Yang for fruitful discussions about motion primitives-based planning and Aditya Dhawale for feedback on this manuscript.

BibTeX

@inproceedings{real-time-gmm-exploration-2019,
  title={Real-Time Information-Theoretic Exploration with Gaussian Mixture Model Maps},
  author={Wennie Tabib, Kshitij Goel, John Yao, Mosam Dabhi, Curtis Boirum, and Nathan Michael},
  booktitle={Robotics: Science and Systems (RSS), 2019},
  year={2019}
}